Obsolete iceScrum documention (R6#14+) This documentation applies only to old iceScrum R6. For new iceScrum v7, click here.
Agile teams should be kept small to be efficient, that is why you may want to split a big project into small teams working on small iceScrum projects. iceScrum Pro project bundles allows you to group these projects and get a big picture of their progression.

A timeline displays the releases and sprints of the projects included in your bundle. For each sprint, the total remaining time, the total availabilities and their difference called “latitude” are displayed so you can know if the estimated work is likely to be completed.
Bundle management
A bundle is a group of interrelated projects. It doesn’t hold much data but rather provides aggregated data from its projects.
Create a bundle

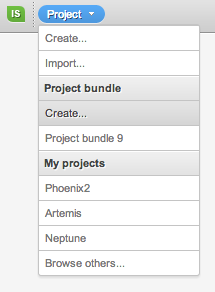
A bundle is identified by a unique bundle name and key (like iceScrum projects).

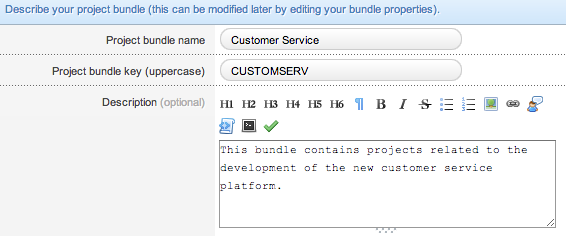
You must be part of every projects you want to include in the bundle. You can have any iceScrum role in these projects: Team Member, Scrum Master, Product Owner, PO & SM and even StakeHolders (for private projects). You can type project names in order enable autocompletion when choosing the projects to include in your bundle.


Bundle access
There is a notable difference between iceScrum bundles and projects: for the moment, bundles can be browsed only by their creator. Thus, every user interested in getting aggregated data would have to create her own bundle.
Since bundles don’t hold data, the fact they are private has few consequences. We will consider a bundle sharing feature as soon as they hold data that is worth sharing.
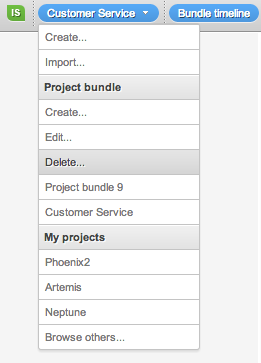
Your bundles are displayed under the “Project Bundle” menu section.

Edit a bundle
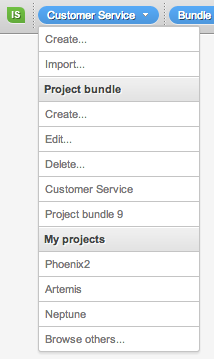
A bundle can be edited by its creator. The “edit” menu is displayed when the bundle is opened. You can update all bundle information: name, key, description and projects.

Delete a bundle
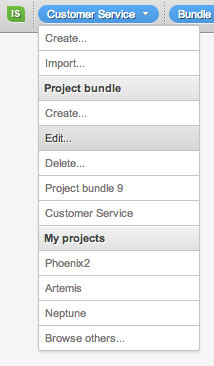
A bundle can be deleted by its creator. The “delete” menu is displayed when the bundle is opened.

Bundle timeline
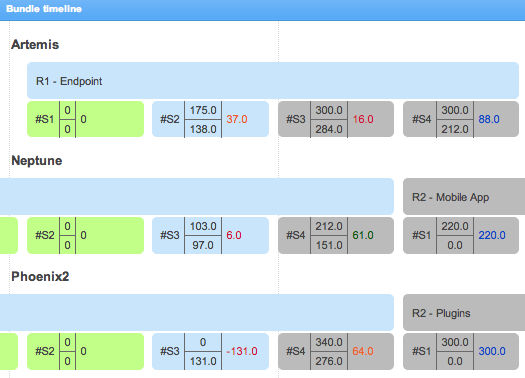
The timeline displays all the releases and sprints of the bundle projects so you can get a global view of their schedule. Additionally, it provides relevant data to help you anticipate issues and take appropriate decisions.


We developed the timeline as part of our sponsoring service that allows companies to give top priority to the development of a feature of their choice. Many thanks to Mondadori Magazines Frances, the sponsor of the timeline. If you too want to sponsor a feature or if you want more details about our sponsoring service, please contact us.
Sprint latitude
The following information is displayed for each sprint:
– Total remaining time: on the top centre
– Total availabilities: on the bottom centre
– Latitude: on the right
![]()
![]()
If your use the same unit (e.g. hours) for remaining time and availabilities, then the difference between them represents the latitude your team have between the expected work and the maximum work that can be done.
You can adapt the color scheme used for latitude display, depending on the characteristics of each projects.
Read more about the sprint latitude here.
Total line
iceScrum doesn’t enforce sprint synchronizations. However, if all the sprints are synchronized (having the same start date and end date) for a given time interval, then a corresponding total element will appear in the total line. The values displayed in the total element are the totals of the values of the synchronized sprints.

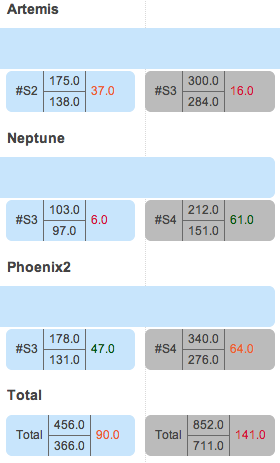
Please note that the color scheme used in the total line can’t be configured, the default one is used (20, 30, 40).